Professional Data Visualizations
All visualizations are high-resolution (300 DPI) and ready for presentations. Click any chart to view full-size. All charts generated using Python's matplotlib and seaborn libraries.
1. WTP Distribution Analysis
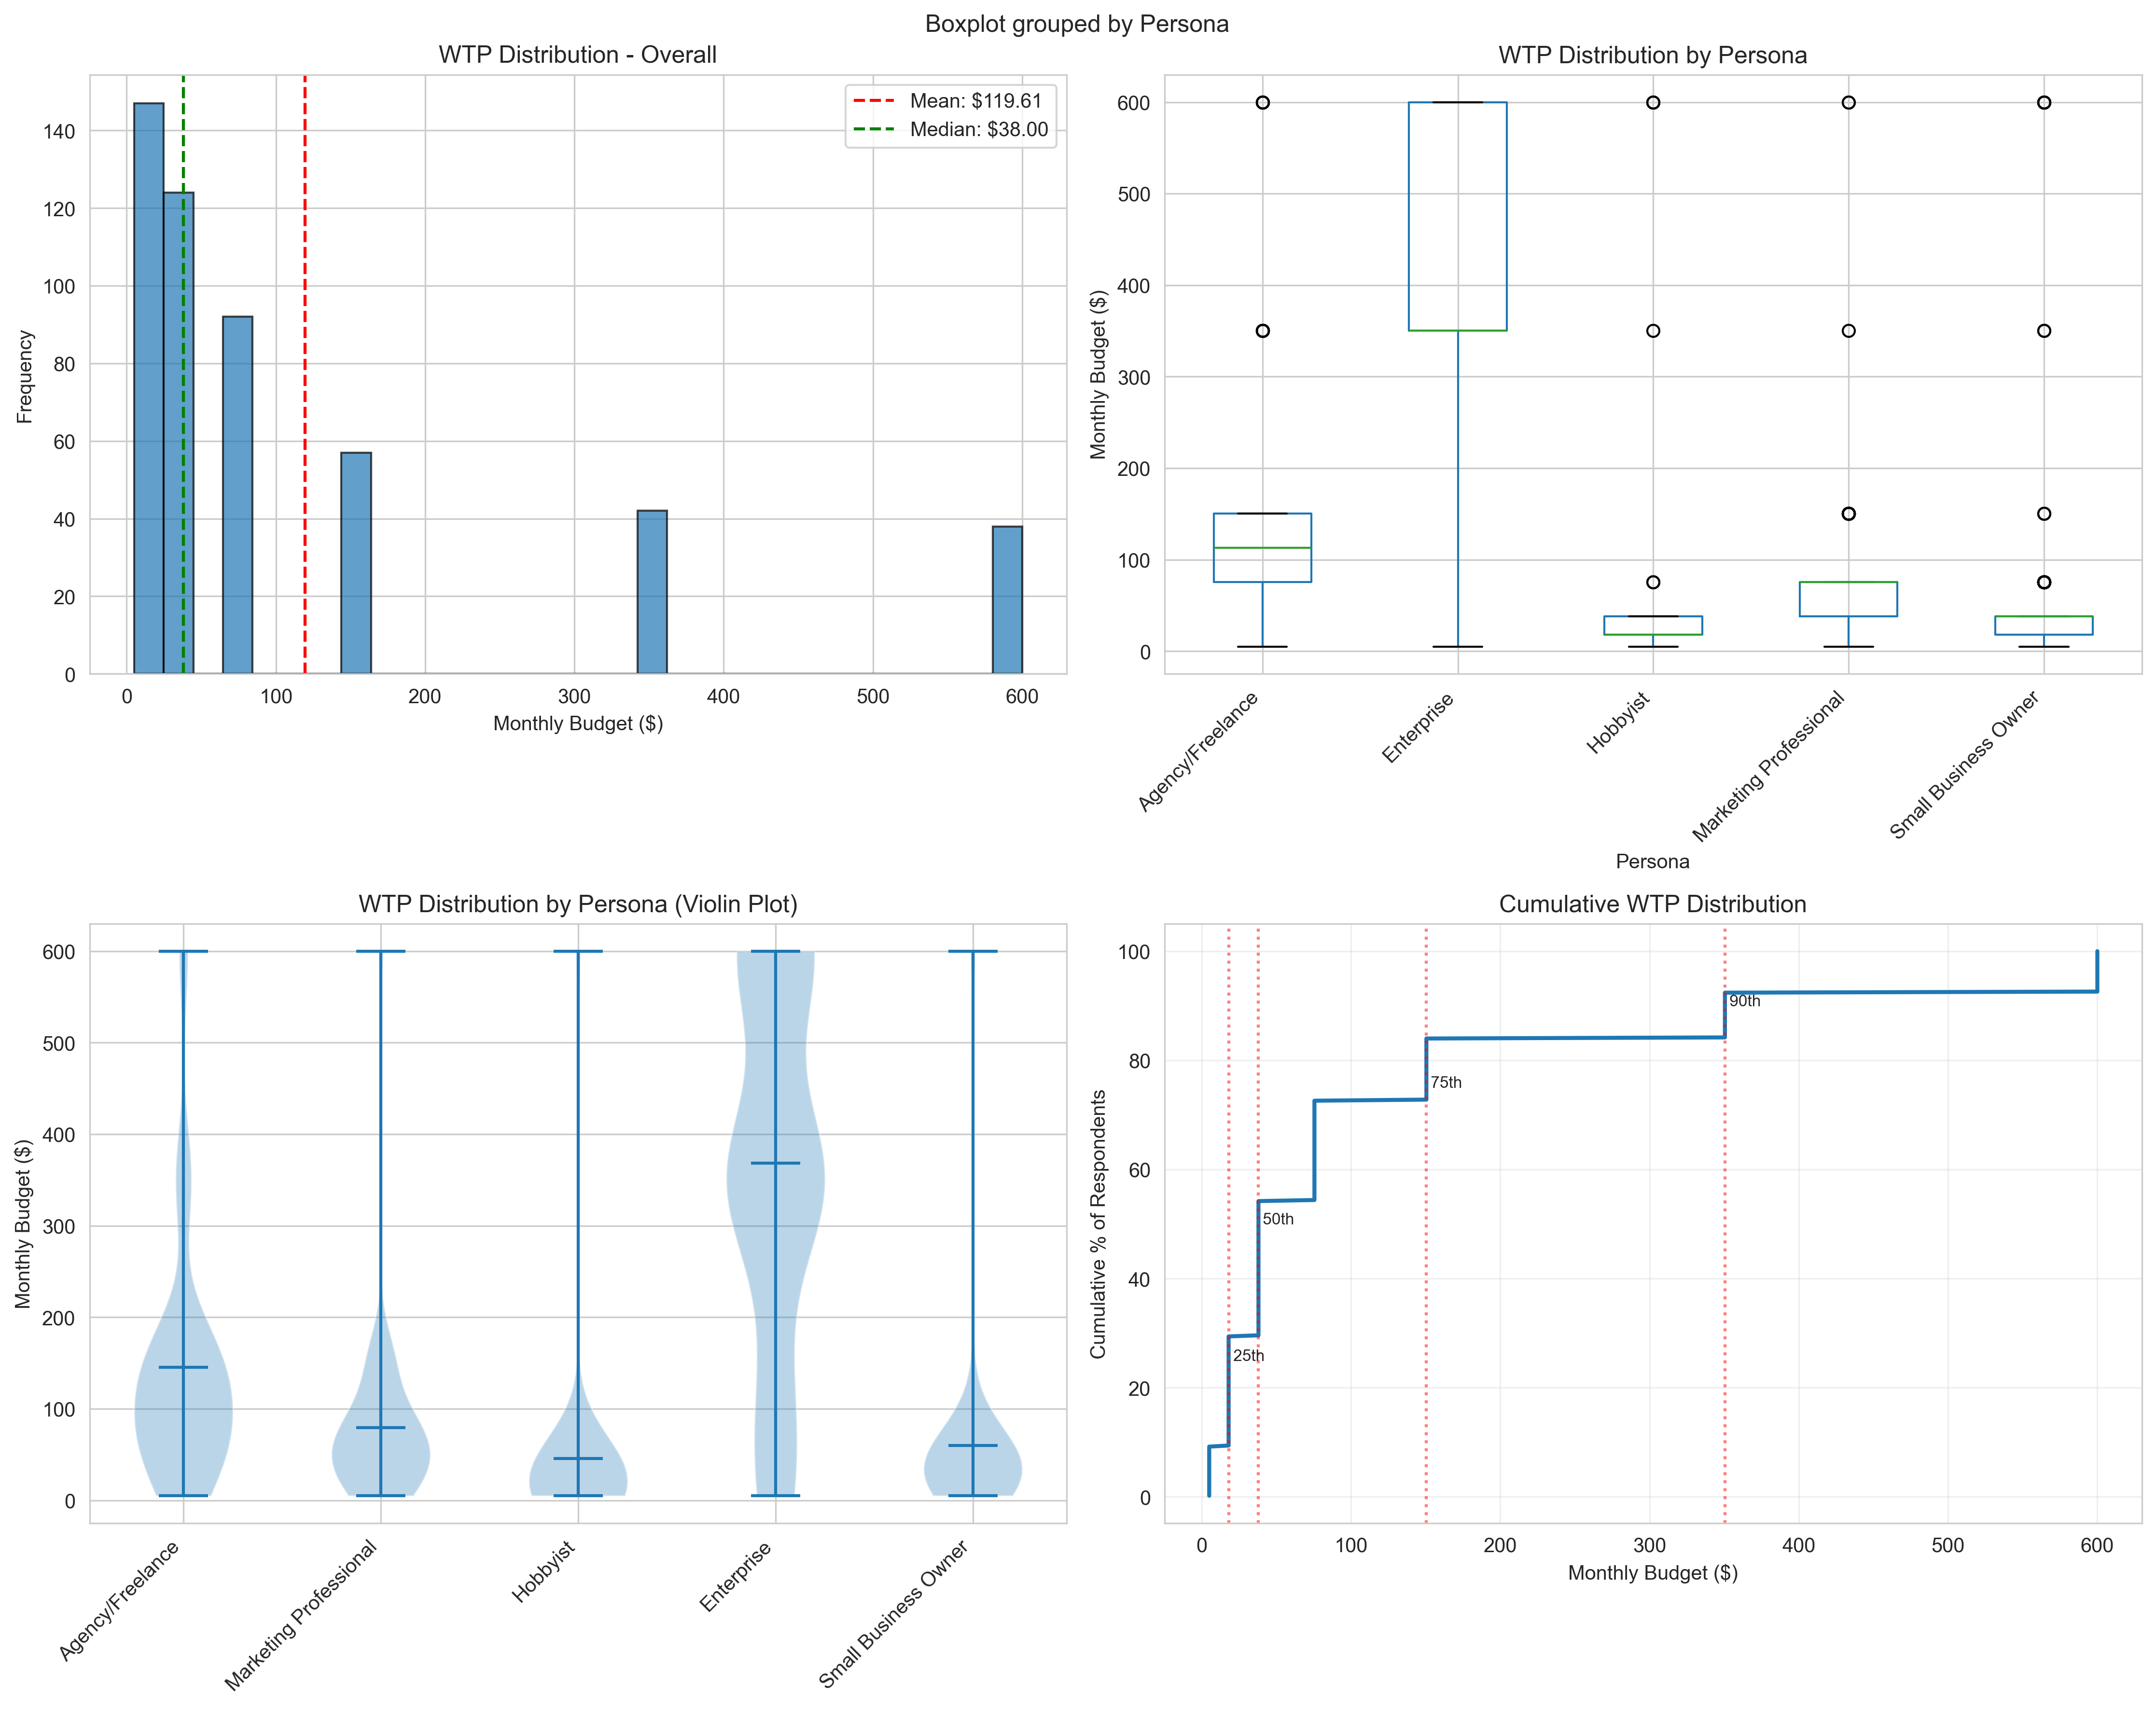
Overall and persona-specific willingness-to-pay distributions
This comprehensive visualization shows:
- Overall WTP histogram with mean ($119.61) and median ($38) markers
- Box plots by persona showing significant variance (8× difference)
- Violin plots revealing distribution shapes per persona
- Cumulative distribution curve with percentile markers (25th, 50th, 75th, 90th)
Key Insight: Right-skewed distribution indicates premium opportunity with Enterprise willing to pay $368/month vs Hobbyists at $46/month.
2. Feature Correlations
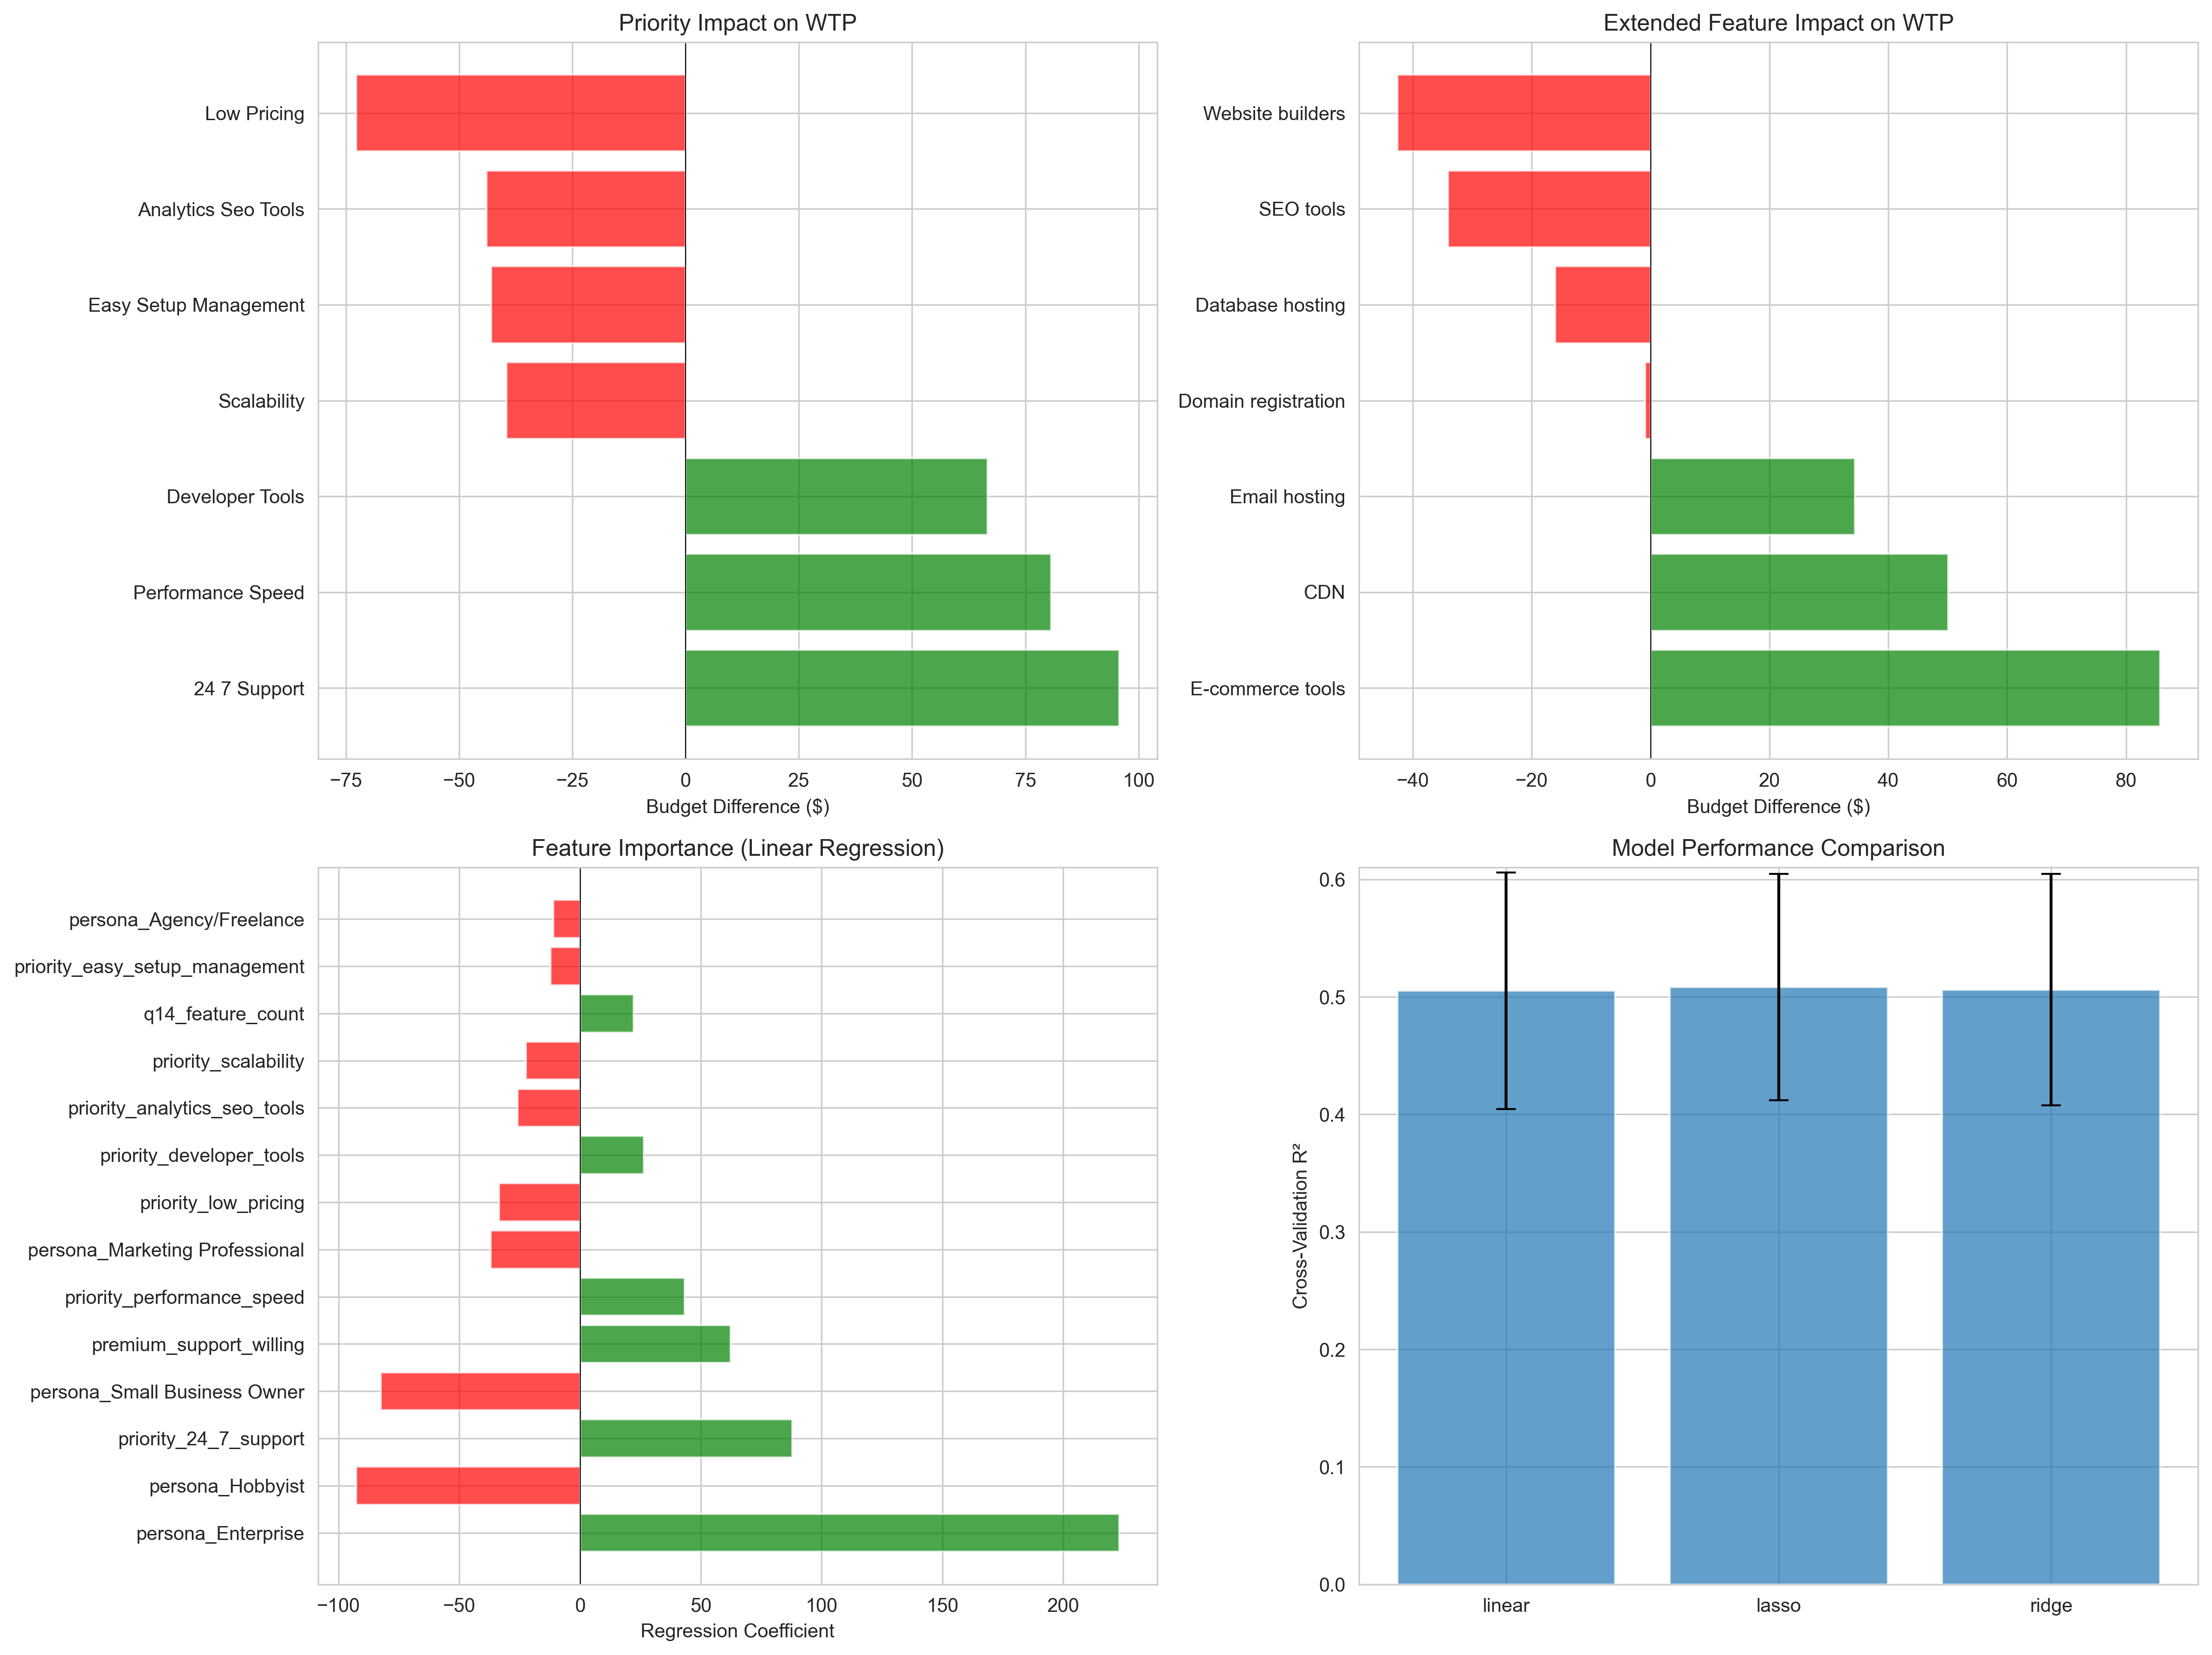
Priority and extended feature impact on WTP
Four-panel analysis showing:
- Priority Impact: 24/7 Support (+$88), Performance/Speed (+$43), Developer Tools (+$26)
- Extended Features: E-commerce Tools (+$86), CDN (+$50), Email Hosting (+$34)
- Regression Coefficients: Enterprise persona (+$223), Premium support willingness (+$62)
- Model Comparison: Lasso regression shows best cross-validation performance (R²=0.508)
Key Insight: Performance features command measurable premiums - reserve for Business+ tiers.
3. Feature Classification Matrix
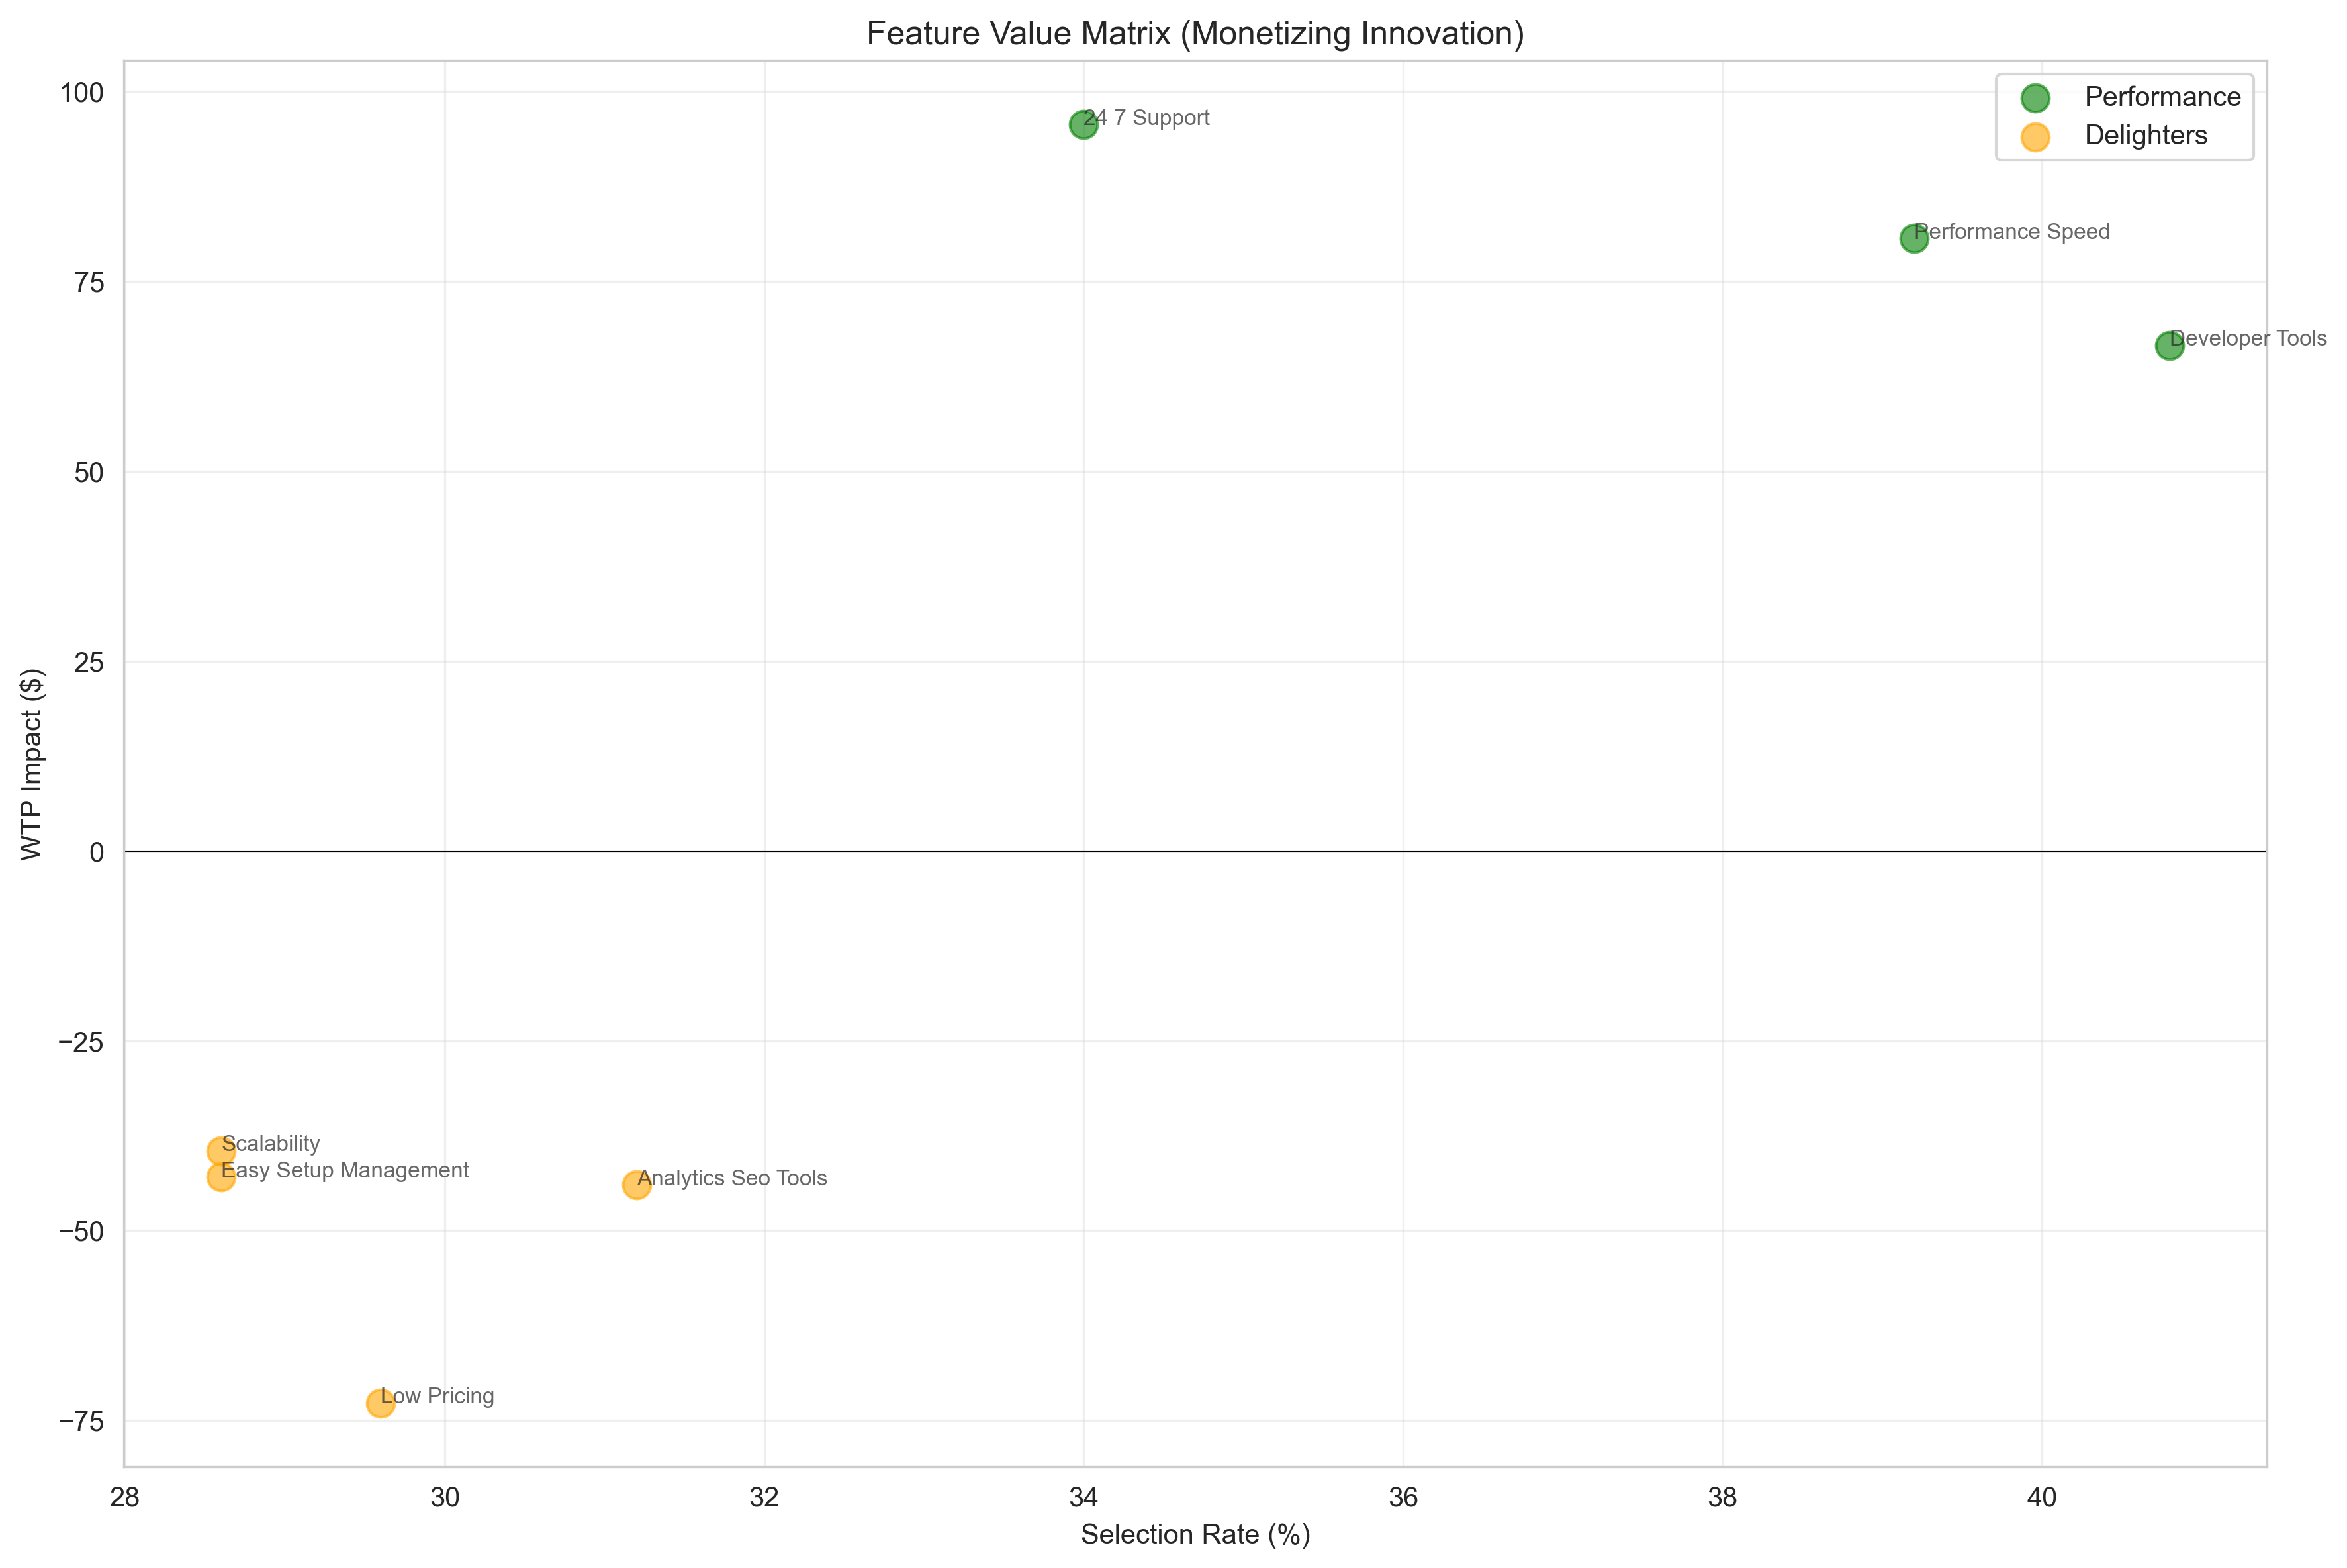
"Monetizing Innovation" feature value positioning
Matrix plotting features by selection rate vs. WTP impact:
- Performance Features (Green): High WTP impact, justify premium pricing
- Table Stakes (Blue): High selection, low WTP impact - include in all tiers
- Delighters (Orange): Nice-to-have features with modest impact
Key Insight: Performance/Speed and 24/7 Support drive WTP premiums and should be tier-gated.
4. Persona Comparison
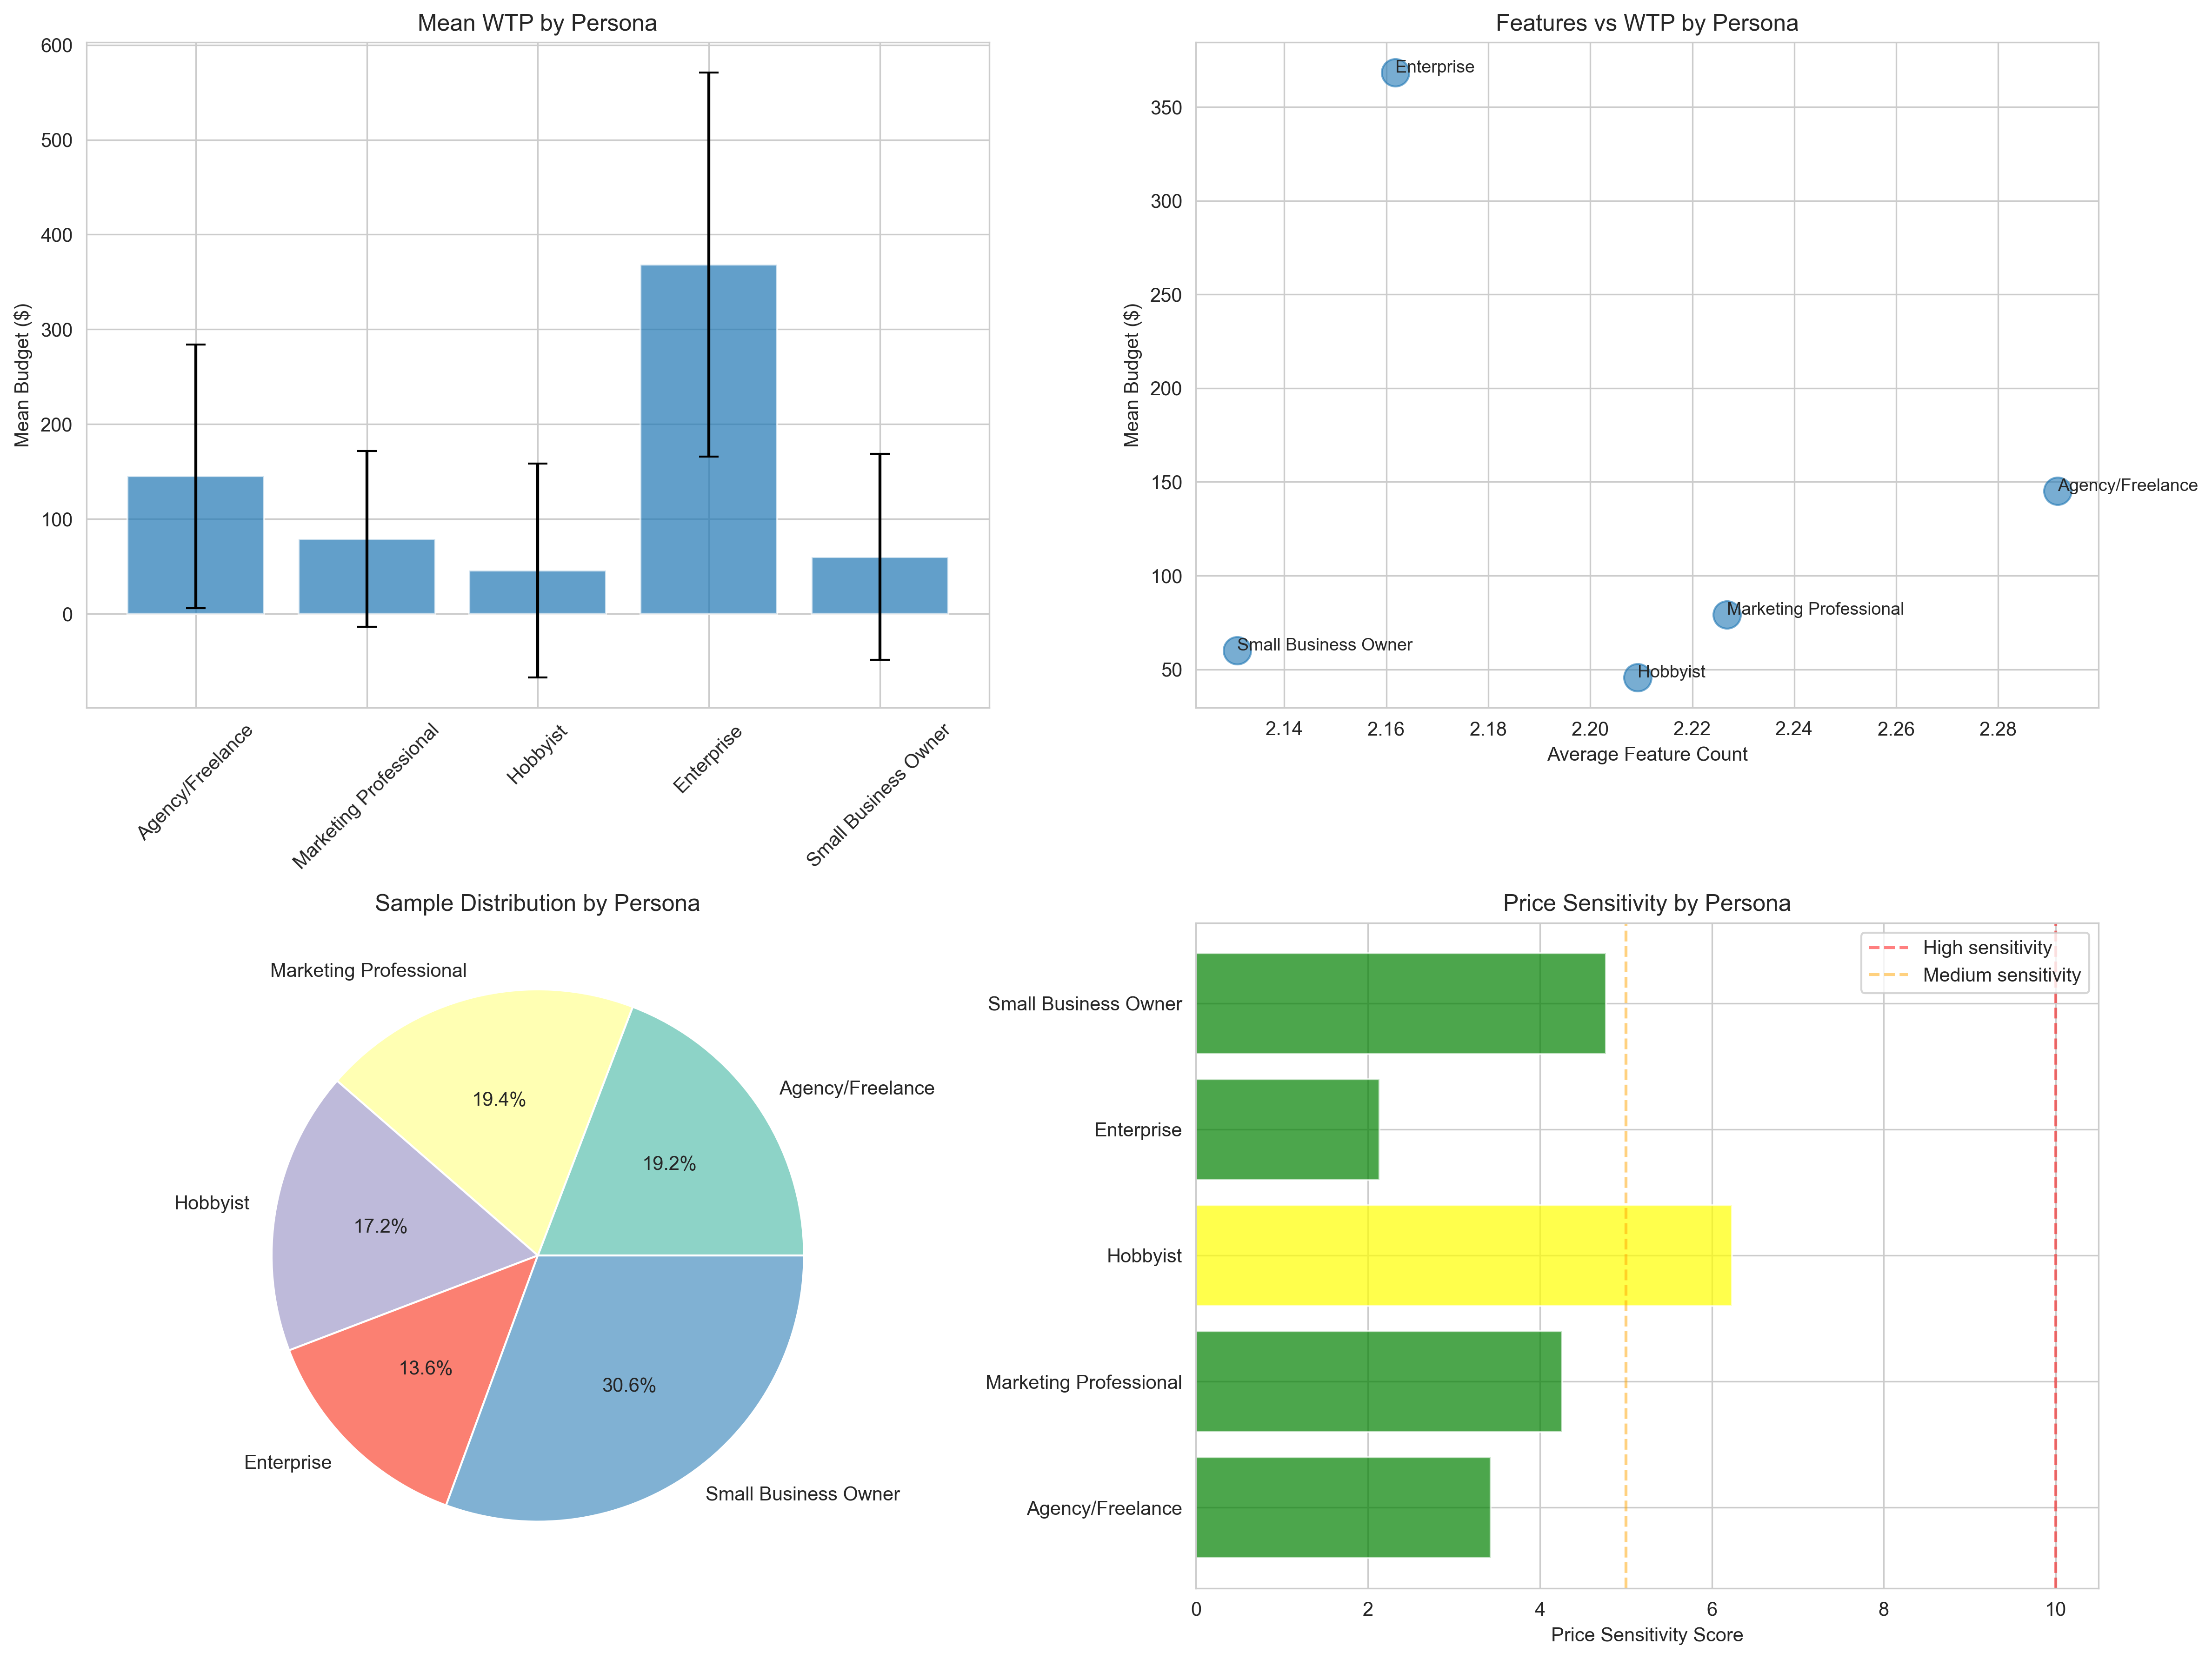
Comprehensive persona analysis across multiple dimensions
Four-panel comparison showing:
- Mean WTP by Persona: Enterprise ($368) >> Small Business ($60) >> Hobbyist ($46)
- Features vs Budget: Correlation between feature count and willingness to pay
- Sample Distribution: Small Business 31%, Agency 19%, Marketing 19%, Hobbyist 17%, Enterprise 14%
- Price Sensitivity: Hobbyists most sensitive, Enterprise least sensitive
Key Insight: Clear market segmentation supports 4-tier pricing strategy targeting different personas.
5. Price Sensitivity Analysis
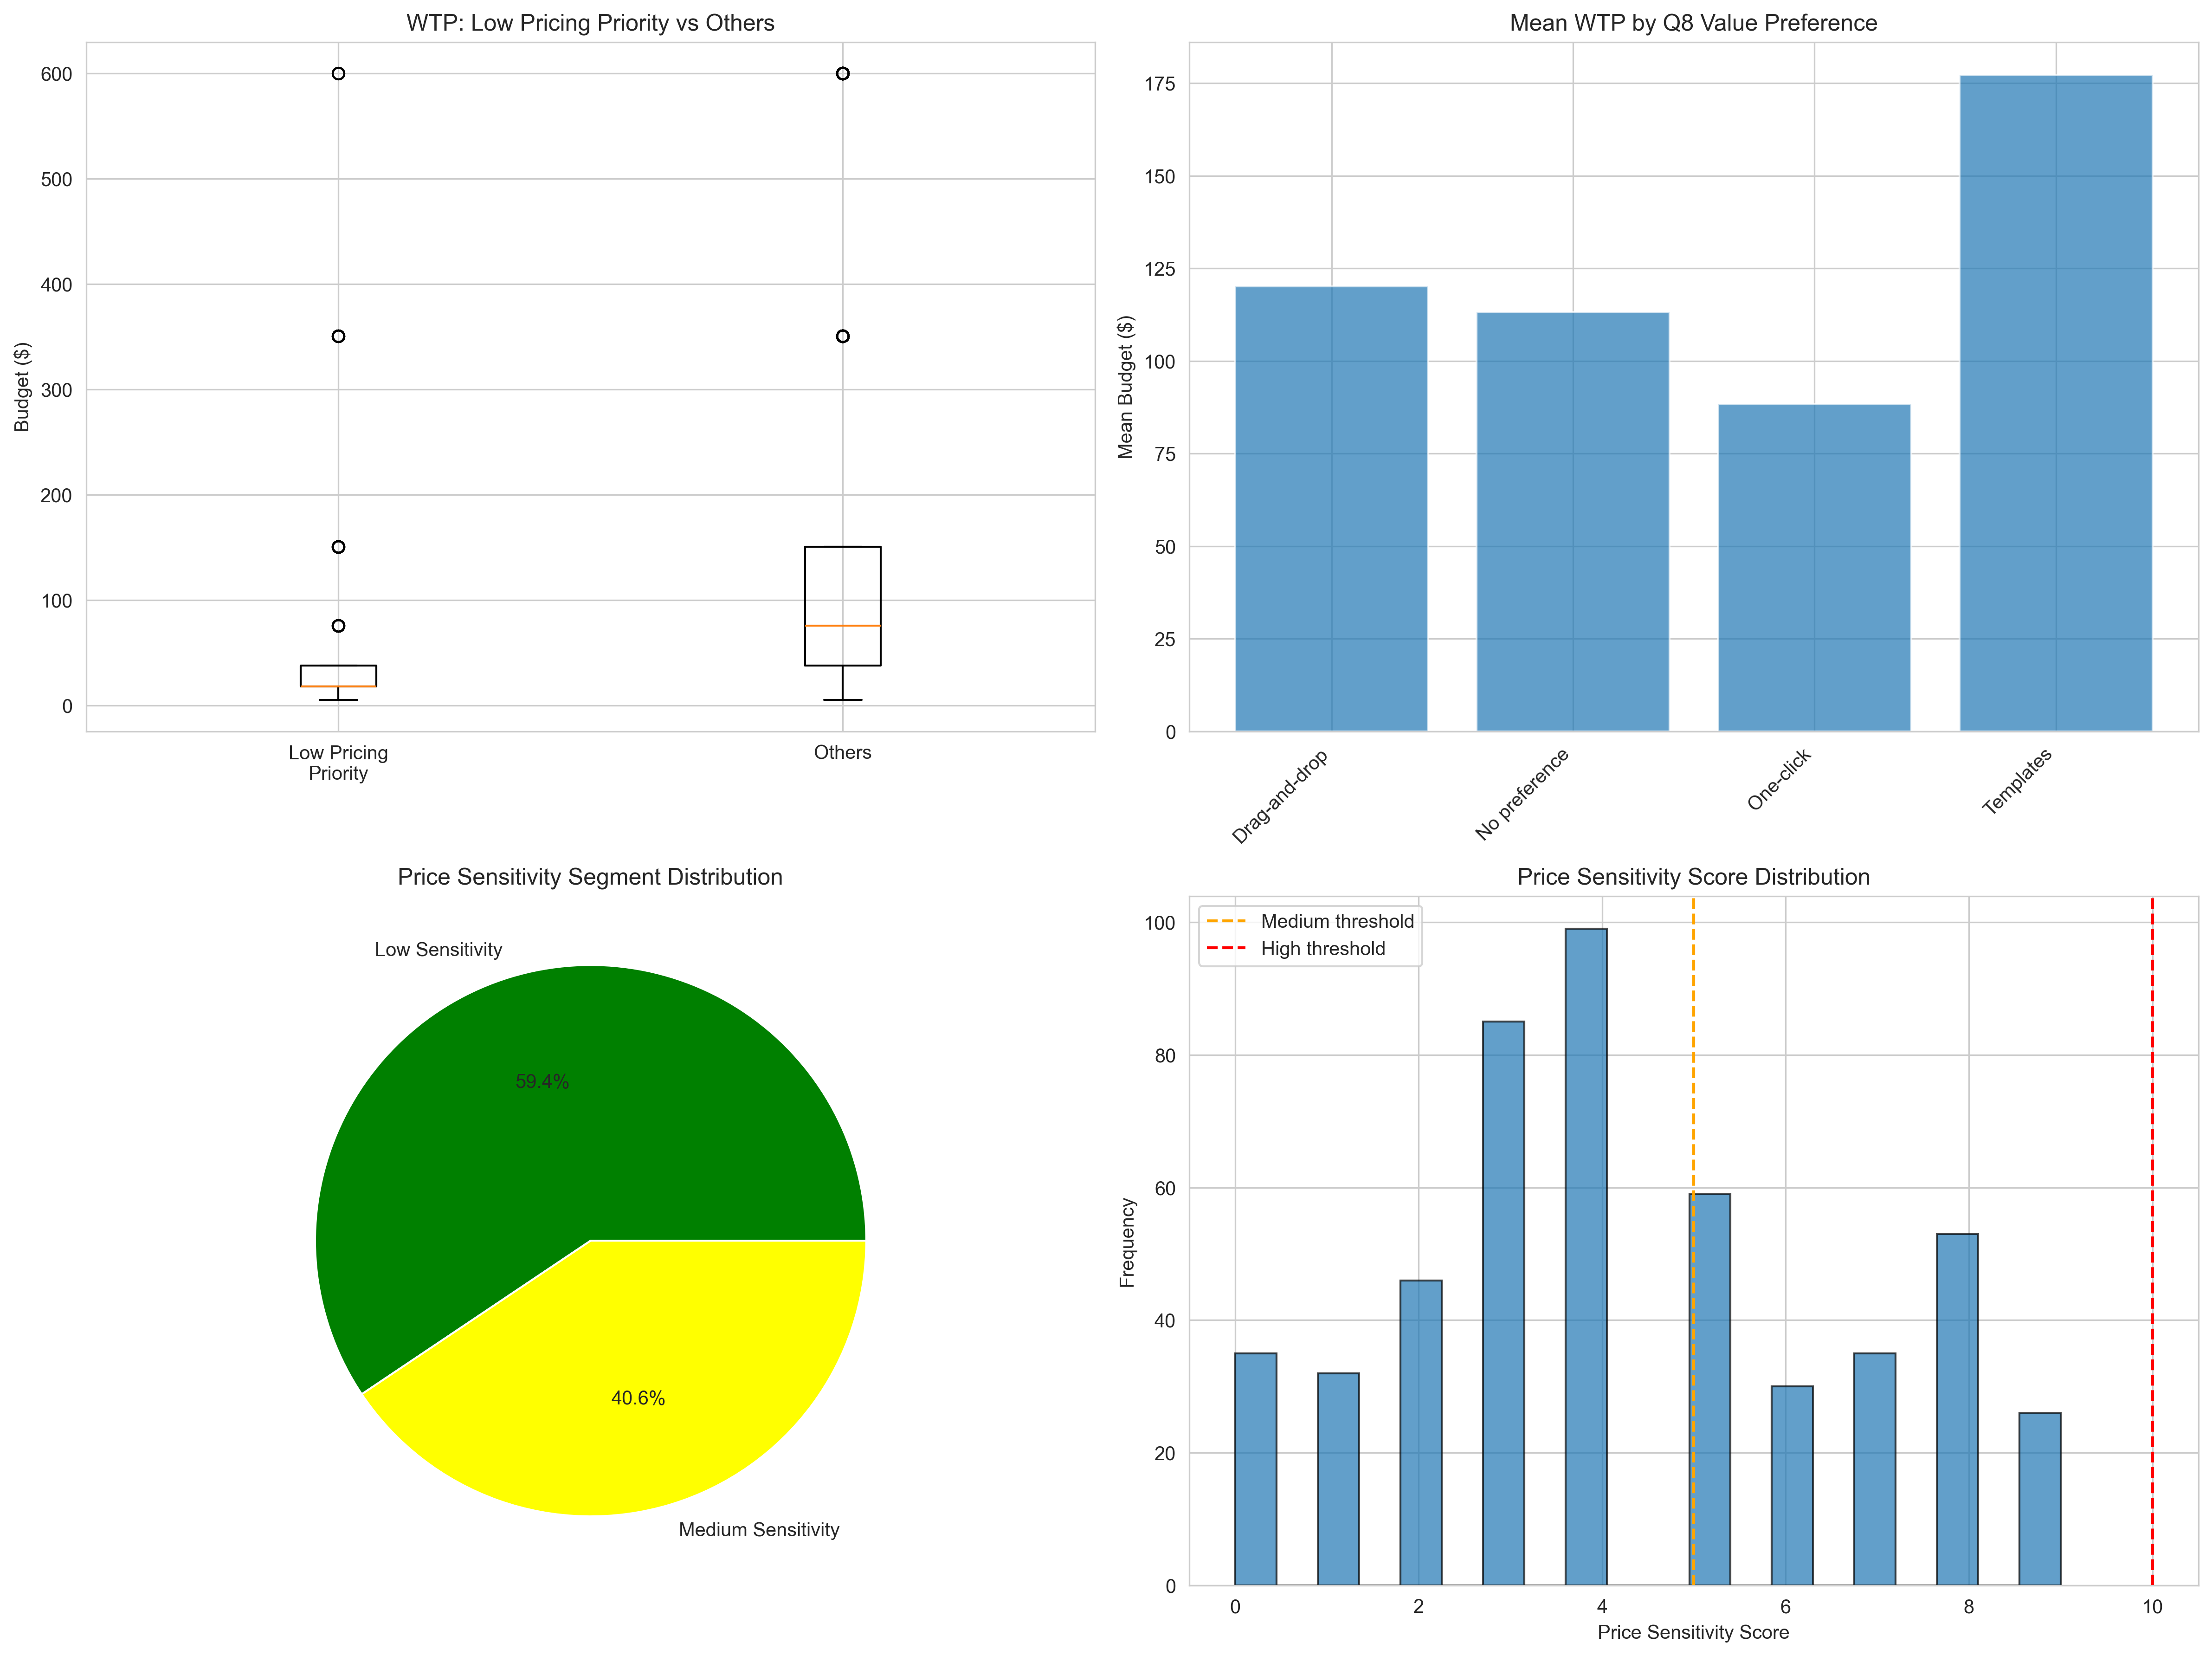
Market segmentation by price sensitivity
Comprehensive sensitivity analysis:
- Low Pricing Priority Impact: -$73 budget difference vs others
- Q8 Value Behavior: Template users show highest WTP ($177), one-click seekers lowest ($88)
- Segment Distribution: 60% Low Sensitivity (mean $182), 40% Medium Sensitivity (mean $29)
- Score Distribution: Bimodal distribution with clear segmentation thresholds
Key Insight: 60% of market is value-focused (not price-focused) - focus premium positioning here.
6. Monetization Models
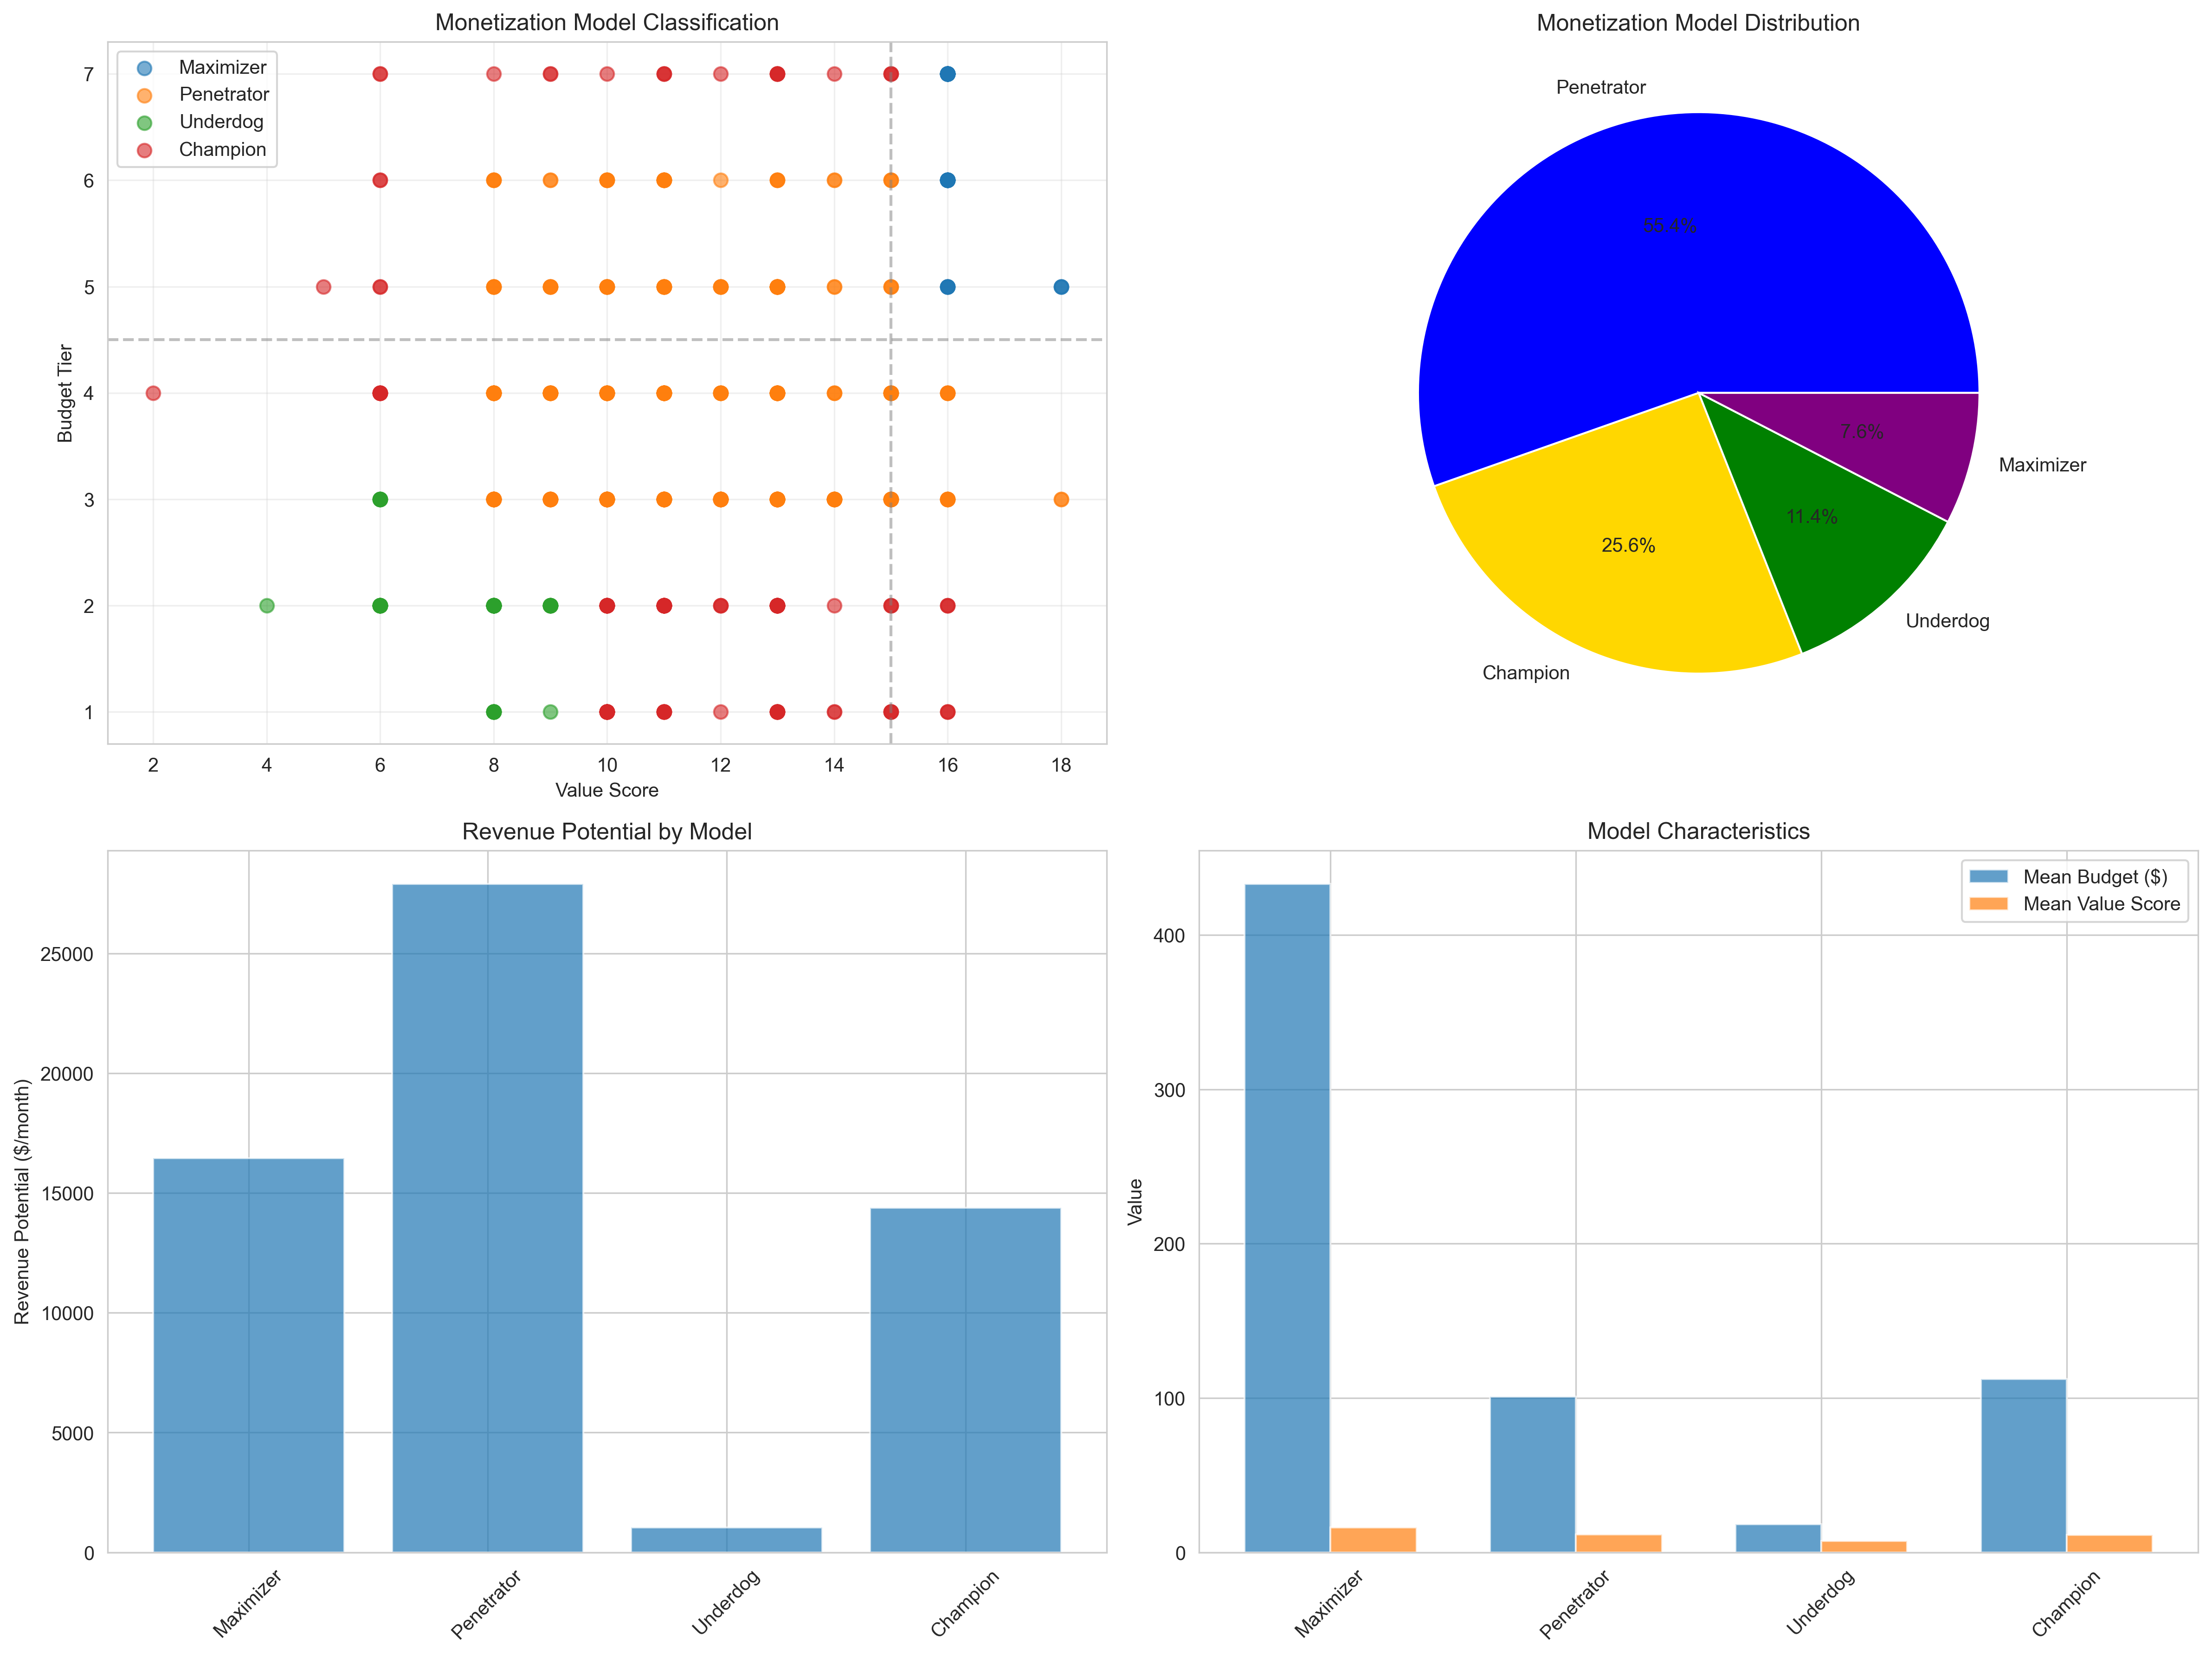
Four Monetization Models framework application
Classification and revenue analysis:
- Penetrator (55%): 277 customers, $27,914/month potential - largest revenue opportunity
- Champion (26%): 128 customers, $14,391/month - risk segment needing optimization
- Maximizer (8%): 38 customers, $16,460/month - premium positioning
- Underdog (11%): 57 customers, $1,042/month - entry segment
Key Insight: Optimize Professional tier for Penetrators (high value needs, competitive price expectations).
📈 Chart Generation Details
Technical Specifications
- Resolution: 300 DPI (print-ready quality)
- Format: PNG with transparency support
- Dimensions: 1200×800 pixels (standard), 1600×1200 (multi-panel)
- Libraries: matplotlib 3.5+, seaborn 0.11+
- Style: Professional whitegrid theme with custom color palettes
- Accessibility: Color-blind friendly palettes used
Regeneration Instructions
All visualizations can be regenerated by running the analysis script:
cd /Users/dkuciel/Visual\ Studio\ Code/2025-11\ WTP\ 2.0
python3 analyze_wtp.py
Charts will be saved to the analysis/ directory with identical filenames.